Thylacine vignette demonstration example (re-run) metrics
Source:R/data.R
thylacine_example_metrics_rerun.RdA dataset containing precalculated (re-run) summary metrics for use when running the
Thylacine example vignette in demonstration mode. The values were obtained by running
the vignette code for 10 replicate re-runs of the selected 'best' 200 model
simulations with DEMONSTRATION = FALSE.
Format
A data frame with 2,000 rows and 4 variables:
- index
Example simulation number from 1 to 2,000
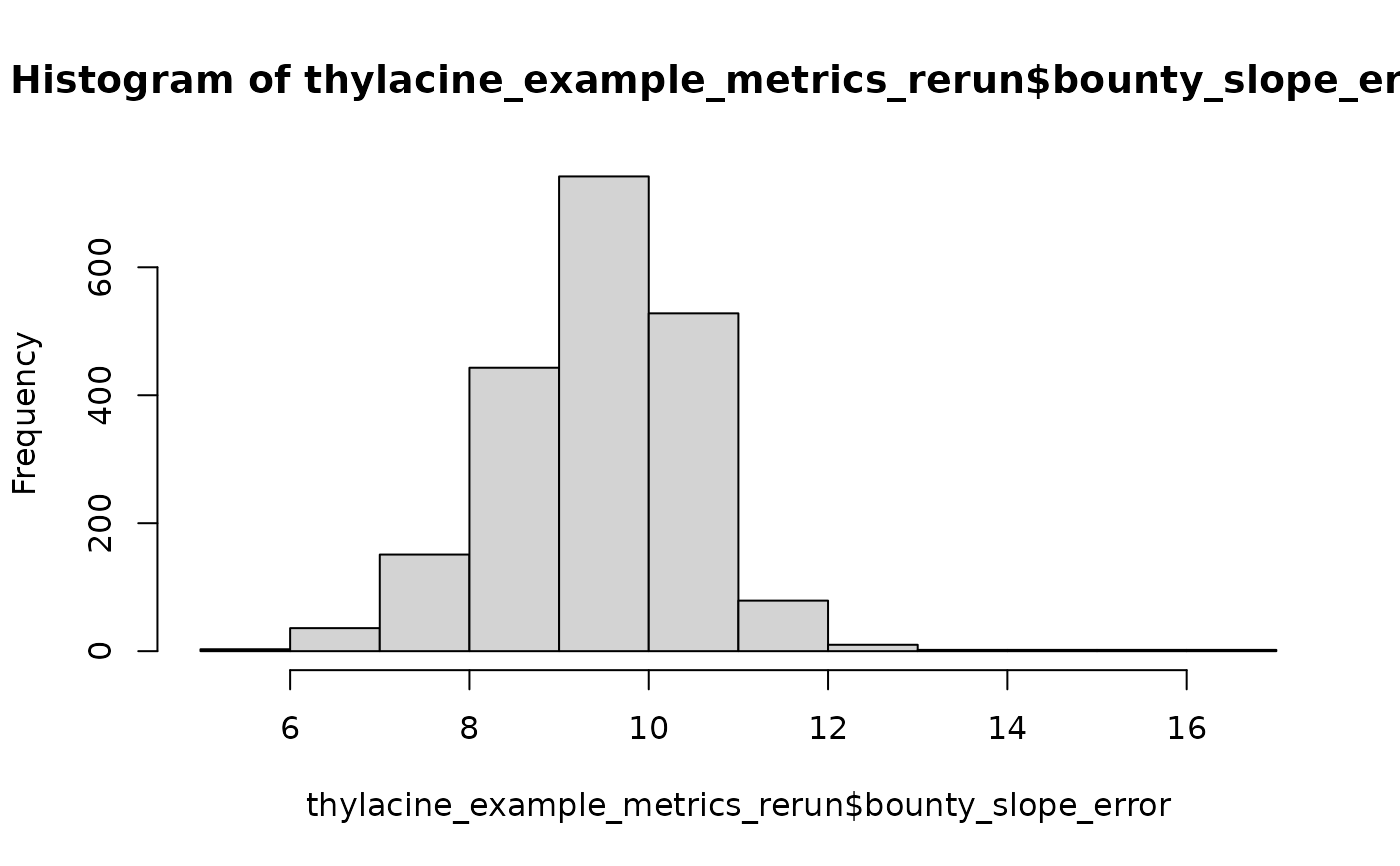
- bounty_slope_error
Root mean squared error (RMSE) from estimated total bounty submitted across three intervals (see vignette)
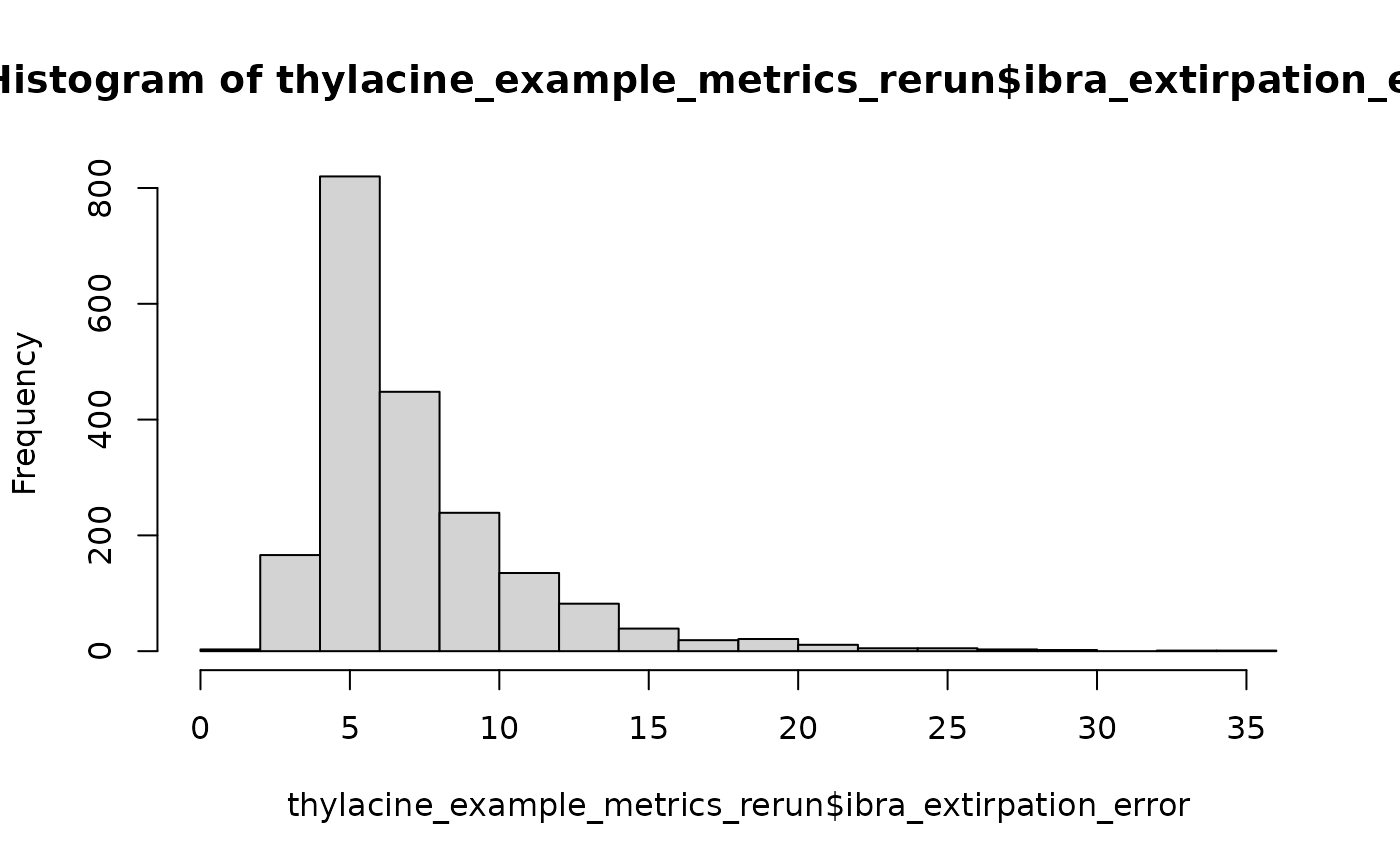
- ibra_extirpation_error
RMSE from estimated extirpation date for each IBRA bioregion (see vignette)
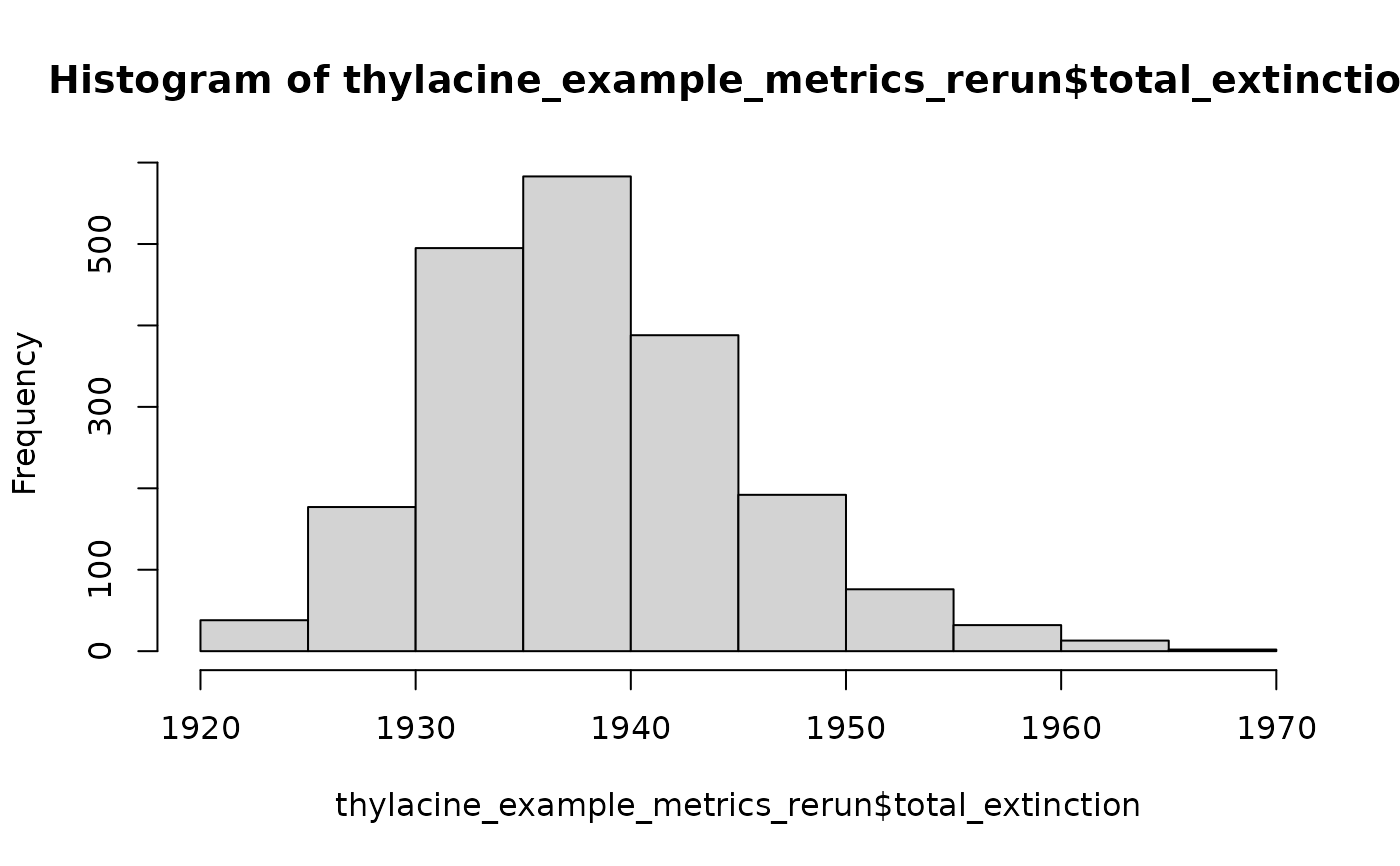
- total_extinction
Total extinction date for each example simulation (
NAwhen persistent beyond 1967)


