A dataset containing precalculated summary metrics for use when running the Thylacine
example vignette in demonstration mode. The values were obtained by running the
vignette code for 20,000 model simulations with DEMONSTRATION = FALSE.
Format
A data frame with 20,000 rows and 4 variables:
- index
Example simulation number from 1 to 20,000
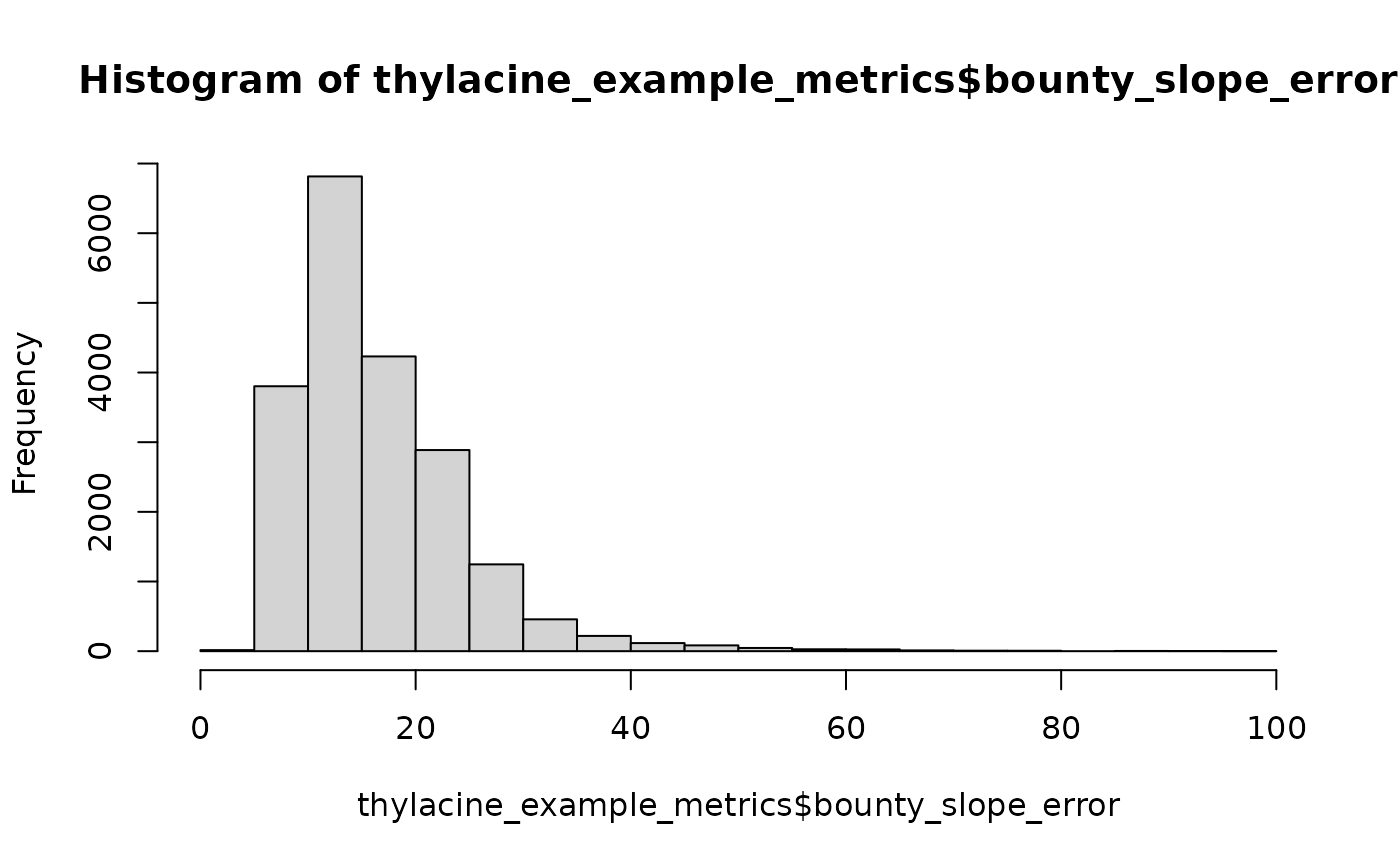
- bounty_slope_error
Root mean squared error (RMSE) from estimated total bounty submitted across three intervals (see vignette)
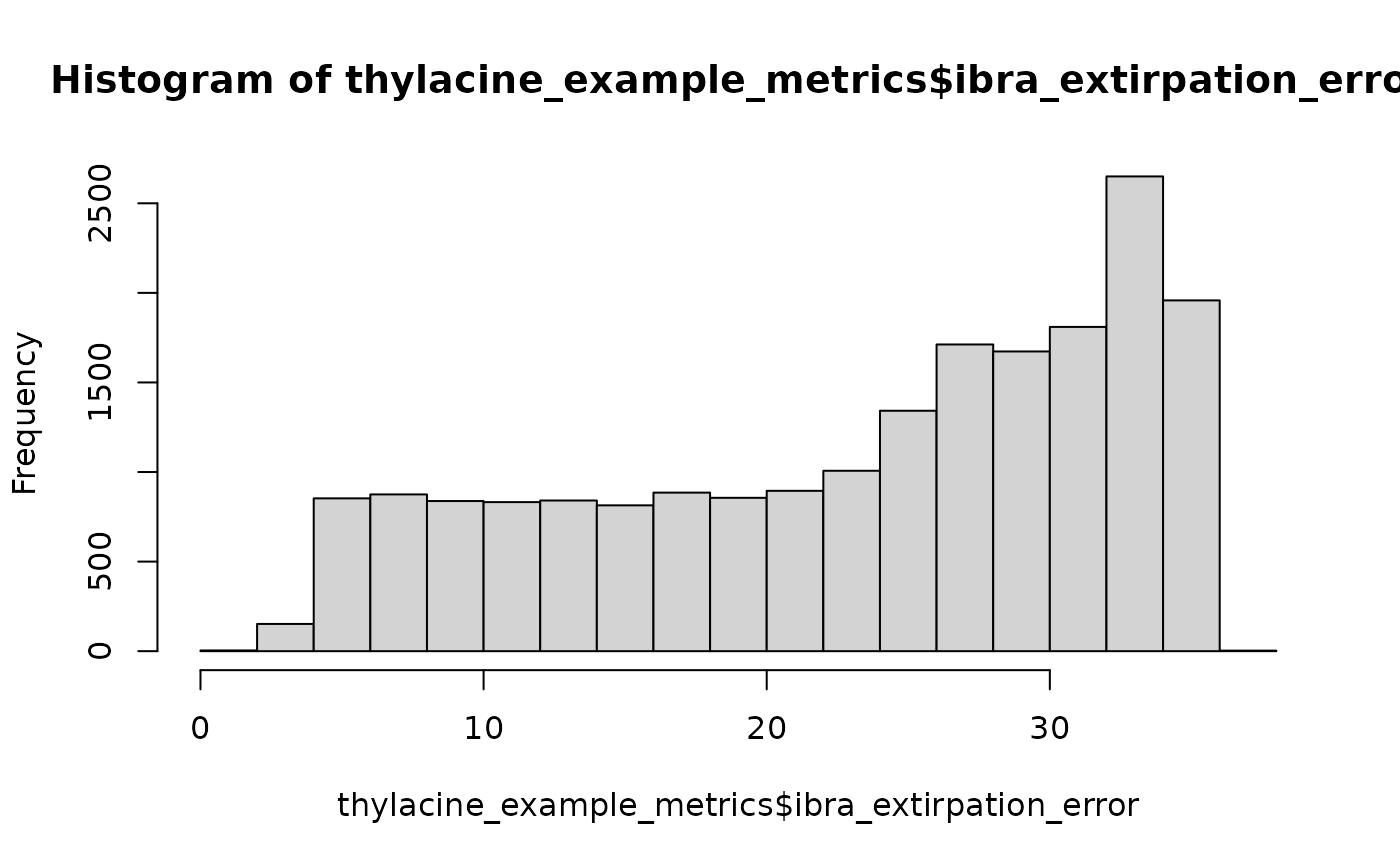
- ibra_extirpation_error
RMSE from estimated extirpation date for each IBRA bioregion (see vignette)
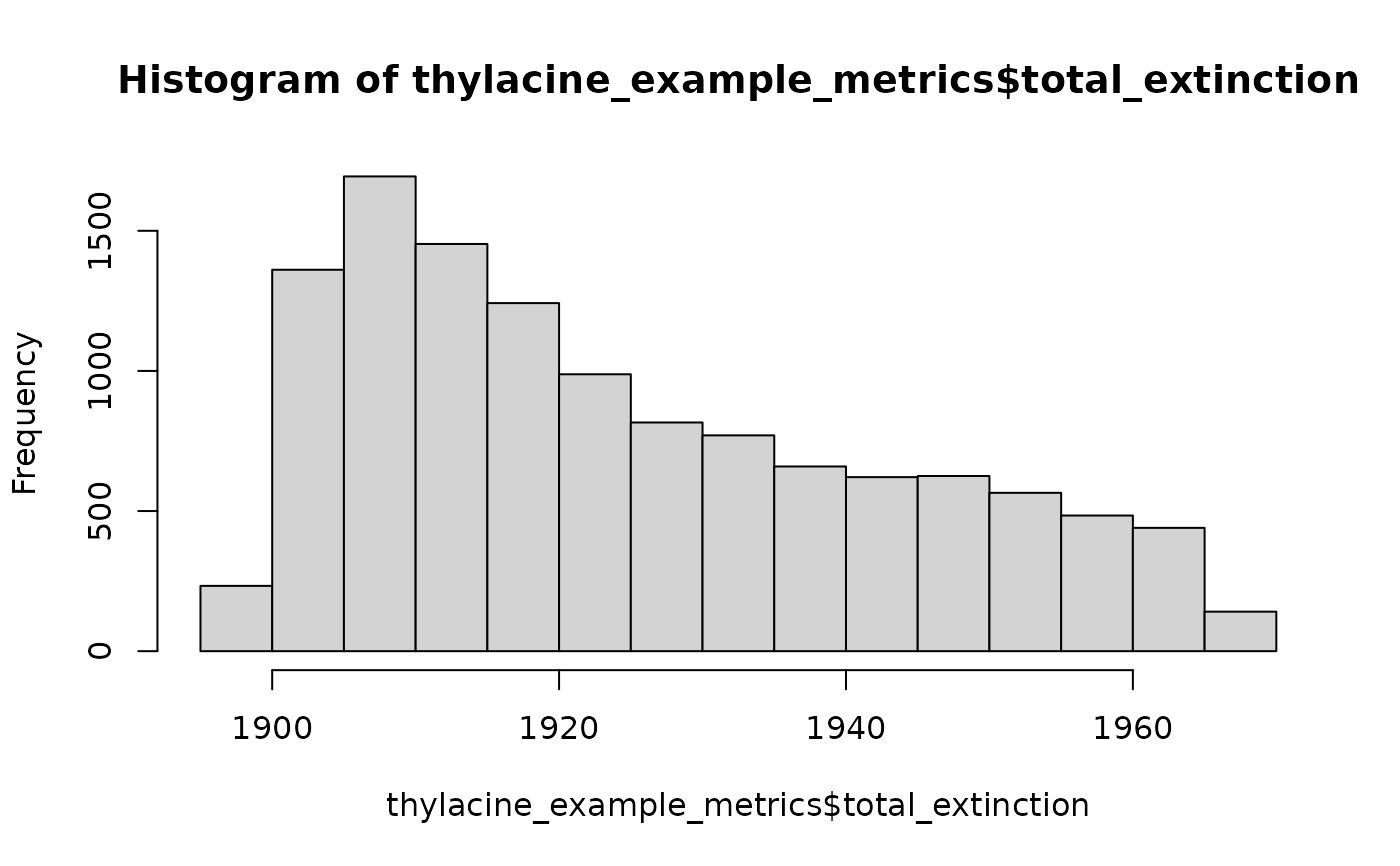
- total_extinction
Total extinction date for each example simulation (
NAwhen persistent beyond 1967)


