A dataset containing precalculated summary matrices for use when running the
Thylacine example vignette in demonstration mode. The values were obtained by running
the vignette code for 20,000 model simulations with DEMONSTRATION = FALSE.
Note that some matrices were only stored for the selected 'best' 200 models.
Format
A list containing the following matrices:
- extirpation
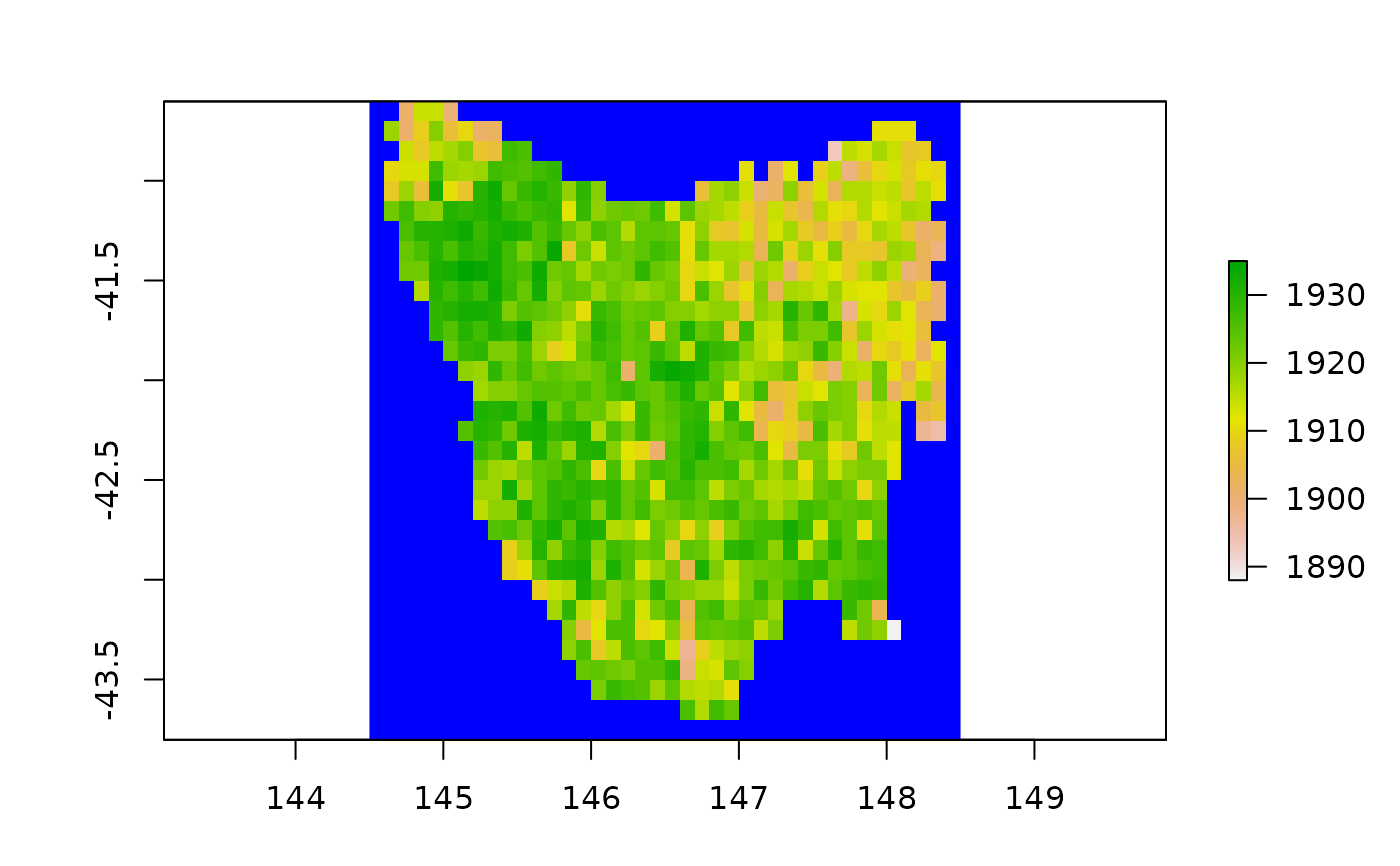
200 row by 795 column matrix of cell extirpation dates for the 'best' 200 models
- total_bounty
200 row by 80 column matrix of bounty submitted each year for the 'best' 200 models
- ibra_bounty
200 row by 9 column matrix of total bounty submitted each IBRA bioregion for the 'best' 200 models
- bounty_slope
20,000 row by 3 column matrix of calculated slope of total bounty submitted across 3 intervals for each sample simulation
- ibra_extirpation
20,000 row by 9 column matrix of extirpation dates for each IBRA bioregion for each sample simulation
