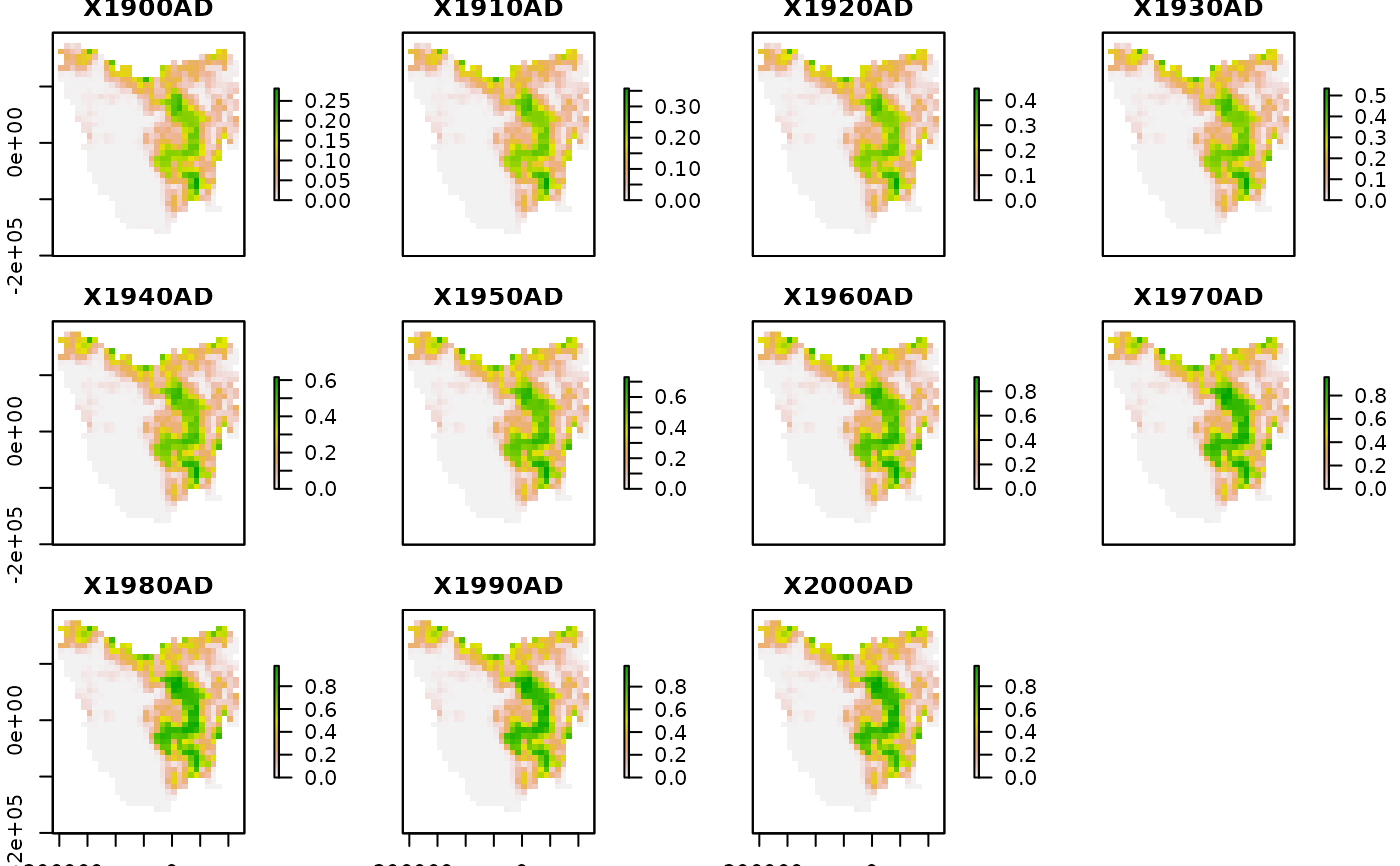
A raster dataset (11 timesteps) defining the intensity land-use cover for each grid-cell in the Tasmania study region. NB. This dataset is projected and will not natively overlay the other raster datasets contained in poems.
Format
A raster::RasterBrick object:
- dimensions
36 rows, 34 columns, 11 layers
- resolution
10km by 10km grid cells
- extent
-211571.8, 128428.2, -182583.2, 177416.8 (xmin, xmax, ymin, ymax)
- CRS
+proj=laea +lat_0=-42.2 +lon_0=147 +x_0=0 +y_0=0 +datum=WGS84 +units=m +no_defs
- values
region defined by 1224 cells with values between 0-1. Values of 1 indicate extensive land use modification)
